The European Atlas of the Seas provides information about Europe’s marine environment. Users can view predefined and ready to use maps, covering topics such as environment, tourism, security, energy, transport, litter, sea bottom, fishing activity, aquaculture, and much more.
Users can also benefit from an enriched catalogue with more than 275 map layers, covering a wide range of topics, to explore, collate and create their own maps. These maps can be printed, shared and embedded in articles or presentations. The Atlas is the ideal tool for schools, researchers and professionals, or anyone wishing to know more about the European seas and its coastal areas.
Dive into the European Atlas of the Seas
Stay on board! Do not miss what is happening. Follow us on Twitter!
Each week, a new “Map of the week” highlighting an interesting map layer is showcased in the Maritime Forum. Dive in and explore your Ocean!
Teachers' corner
Are you a teacher or an educator interested in ocean literacy? The teachers’ corner of the European Atlas of the Seas contains exercises for different age groups as well as communication tools. It is an open platform where you can find and share information, educational material, inspirations and much more!
Discover our teaching resources
Visit the Atlas Overview and Watch the Atlas video tutorial
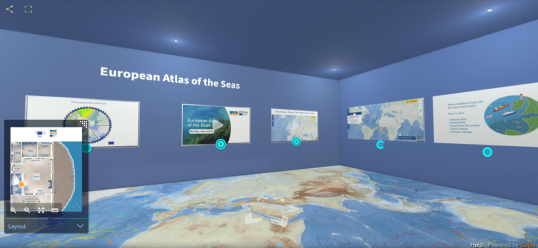 |
New: Visit the EMODnet Virtual Exhibition!
|
Latest Maps of the Week
Map of the Week – Climate Change – Global Mean Sea Level Regional Trend
This map shows the spatial distribution of sea level trends since 1993. It reveals that sea level is rising for the vast majority of the global ocean but there is large-scale variation.
Map of the Week – European Union Mission Restore our Ocean and Waters
This map shows the Mission Actions pledged by stakeholders across Europe to achieve the objectives of the European Union (EU) Mission ‘Restore our Ocean and Waters’ by 2030. Have a look at the EMODnet pledge!
Map of the Week – Waste and Plastic Reduction
This map shows the kind of litter that ends up on European beaches according to several categories (glass, textile, metal, polymer, etc.).
Map of the Week – Drifting buoy temperature tracks (Monthly)
This map shows the temperature measurements recorded over the previous month by the worldwide array of drifting buoys.
Map of the Week – Science and Marine Research Installations
The map shows marine research infrastructure, including research vessels and embarkable equipment, on-land and offshore research and test facilities as well as numerous remote and in-situ observation facilities.
Map of the Week – Global mean sea level regional trend
The map shows the spatial distribution of sea level trends since 1993.