On 26-28 March 2024, scientists from around Europe gathered in Delft (The Netherlands) for the official Kick Off Meeting of the new LandSeaLot project, a Horizon Europe project that seeks to integrate and enhance existing observation efforts – including in-situ observations, satellite observations, modelling and citizen science – to better study the land-sea interface [1]. The land-sea interface is broadly defined as where the land surfaces and water bodies meet. It spans the region where the terrestrial and marine ecosystems interact. From food security to climate regulation and cultural enrichment, the benefits bestowed by both terrestrial and marine ecosystems are manifold. However, the land-sea interface faces heightened vulnerability due to climate change and pollution, causing intensifying consequences to local human communities and biodiversity. This underscores the importance of understanding the intricate interplay between these ecosystems in the land–sea interface.
Now, turning our attention to the coastline, did you know that the European Union has a coastline spanning approximately 68,000 kilometers? [2] Nearly half of the European Union (EU)'s inhabitants reside within a mere 50 kilometers of the sea, mainly in urban centres dotting the coastal landscape. These vibrant coastal regions are not merely centres of social and economic activity, but also crucial hubs of biodiversity, hosting diverse ecosystems that offer vital habitats and food sources. The map of this week shows the geological patterns of the European coastline. The data show different types of shoreline and coastline formations, including, for example, rocks / hard cliffs, small beaches and estuaries. Zoom into the map to see what geological types or landforms are there along the coastline! Can you locate areas where artificial protections were built to secure the coastal population and activities? Besides artificial dykes, nature-based solutions for coastal protection has become increasingly important and favoured to combat flooding, erosion and biodiversity loss. Understanding the coastal geology is therefore very important.
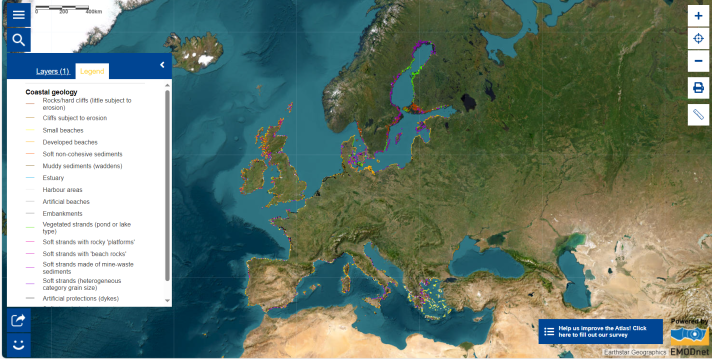
Have you noticed that we have used the ‘Civil template’ basemap in the Map of the Week this week? With the ‘Civil template’ basemap, it is possible to see the land use and intensity of human activities along coastal and deltas regions. Click the ‘layers’ tab to change the basemap to another basemap of your choice (e.g. EMODnet template or Cities template)! Wish you could also see rivers and lakes? Use the search tool (magnifying glass) to add the map layer ‘Rivers and lakes’ to the map!
Wish to learn more?
- The LandSeaLot project includes an important component to engage citizen scientists to share experience, promote interests and practices, and secure a project legacy. Would you like to engage? Explore the LandSeaLot project website!
- Understand some key challenges facing the coastal environment.
- Read about some EU-funded nature-based solutions projects that tackle the climate and biodiversity crises.
- Learn about rivers, estuaries and delta, the interconnected waterbodies and landforms that connect the terrestrial and marine systems.
The data in this map is provided by EUROSION.
[2] https://www.eea.europa.eu/themes/water/europes-seas-and-coasts/europes-seas-and-coasts