Welcome back to the classrooms! As the new school year has already started in some schools and is about to start in other schools across Europe, the European Atlas of the Seas’ team looks forward to a wonderful and exiting academic year ahead! Will you be learning about the ocean this year? Will you be developing a project related to the ocean and seas? The European Atlas of the Seas can help you! With a catalogue of more than 270 map layers available in 24 languages, whether you will be working on marine sciences, pollution at sea, climate change, marine biodiversity or a wide range of other topics, you can find information to support your work! But that’s not all. The Atlas also includes a Teachers Corner where you can find map-based exercises, games, posters and presentations!
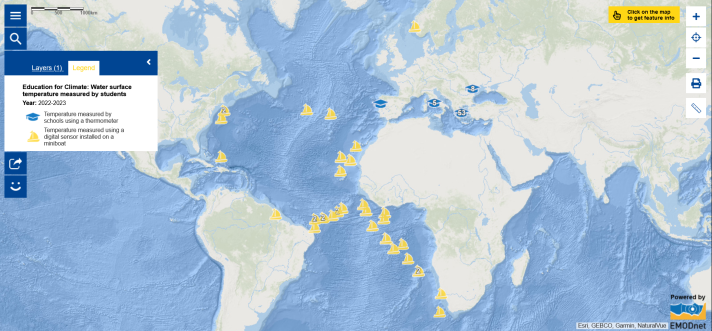
So, you can find a lot of information and activities in the Atlas. But, schools can also help advance knowledge about the ocean in many different ways! Did you know that there is an educational map layer in the European Atlas of the Seas that was developed thanks to data provided by schools and data collected from miniboats built by schools? Schools can be data providers! On this last week of August, we have of course selected this map layer as the Map of the Week!
This map layer shows the outcome of the challenge 'Be a scientist! Mapping climate change at seas & waterways' organised by the Education for Climate Coalition and the European Atlas of the Seas in 2022-2023. Schools across Europe were invited to become data providers for a new map layer in the Atlas. Teachers chose to measure water surface temperature at sea, in rivers, lakes or ponds. Schools could measure the water temperature in different locations and at different times. They provided the results of their measurements and all necessary related information by completing an online form. By doing so, students learned about data collection, data harmonisation, data visualisation and data sharing. Several schools used a thermometer measure the water temperature. Related data are represented by graduation hats on the map. And, thanks to the collaboration of the Partnership for Observation of the Global Ocean (POGO) and Educational Passages, the Atlas Team also received data from schools who have built miniboats deployed at sea which are equipped with temperature sensors! These data are represented by boats on the map! Click on the graduation hats and the boats on the map to see the data provided by the schools, POGO and Educational Passages. When you see a number on a symbol, make sure to click on the arrow in the top right-hand corner of the information window to view all received data.
As different methods were used to measure the temperature and temperature was measured at different times in different locations, data in the different locations cannot be compared. But the map layer helped students learn how maps are made and highlights the benefits of data sharing.
Everyone now has access to the data collected by the schools! The map can be used as teaching material by these schools, other schools and anyone interested!
Looking for resources on the ocean or ways to bring the ocean into your classroom? We have prepared a list for you! Dive in!
- Read other recent Maps of the Week;
- Watch the Atlas’ video tutorials to learn how to use the My Maps tool to create your own working space in the Atlas and the Measure tool to measure distances, estimate surface areas and see the geographical coordinates of any location on a map;
- Test your knowledge with the Atlas’ quizzes and play the Atlas Blue Economy Challenge game (if you are a teacher, make sure to check the Teachers Guide);
- Learn about the Network of European Blue Schools and find out how you can join them;
- Find out about Underwater and Coastal Cultural Heritage with UNESCO;
- Explore UNESCO’s Ocean Literacy Portal and State of the Ocean Report 2024;
- Check out the activities of the Education for Climate Coalition;
- Visit EuroGOOS’ Ocean Literacy Resource Library;
- Have a look at the European nature protection toolkit;
- Stay tuned for updates in the Atlas, new Maps of the Week published every Friday and upcoming news!
Enjoy the new school year!
The data in this map are provided by the Education for Climate Coalition.

