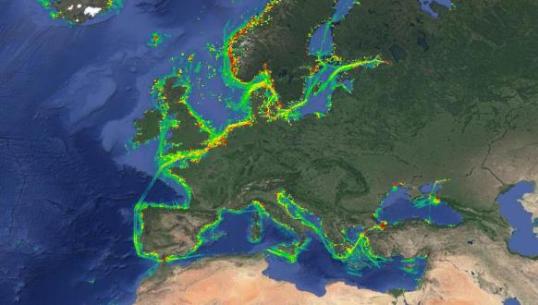
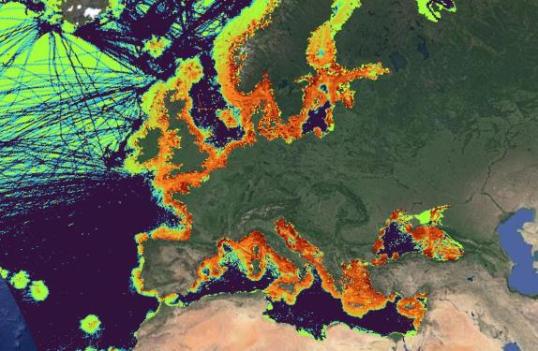
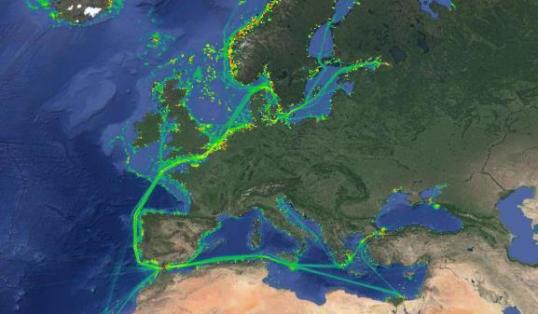
| Density map based on Ter AIS, for all vessel types, using a resolution of 10km, for the month of December 2021 | blue and purple colours indicate areas where Sat AIS have larger density values; yellow and red point to larger Ter AIS densities, while green indicates equal values from both sources (December 2021) | Density map based on Sat AIS, for all vessel types, using a resolution of 10km, for the month of December 2021. |
Maps of vessel density can be derived from the GPS-based Automatic Identification System (AIS) used by ships to signal the position of nearby ships and thus avoid collisions. These are transmitted by FM radio signals and can be picked up by shore stations provided the ships are within about 40 nautical miles of the coast and thus above the horizon and also by earth-orbiting satellites. The signals can identify the type of vessel (fishing, tanker etc.) and the vessel density maps derived from these signals are available through the European Marine Observation and Data Network (EMODnet) for European waters and on other platforms for specific purposes such as identification of illegal fishing.
A study carried out by MarineTraffic, the ship tracking and maritime intelligence company, has analysed the accuracy of these density maps and concluded:
- considerable effort is required to clean the data mostly because some data, such as type or identification of vessel, are input manually and can be wrong but also because some malfunctioning provides misleading positions.
- smaller vessels carry a simplified “Class B” system which is less visible from shore-based sensors than the “Class A” system used for larger vessels and almost invisible from satellites.
- the visibility of individual vessels from satellites varies depending presumably on how the on-board transponder is set up.
- many vessels in crowded areas can be picked up by shore based receivers but not satellite based ones because of a longer interval between signals and a collision between signals. In European seas the number of vessels picked up by satellites is less than half of those picked up by shore-based receivers except in the Black Sea where there are fewer shore-based receivers.
- the analysus shows a strong complementarity between sources that can provide a more complete picture of reality:
- using artificial intelligence and machine learning techniques, earth observation imoages can detect vessels. Sentinel1 radar satellites and Sentinel2 multispectral optical satellites can detect vessels that are invisible to satellite or shore-based sensors but cannot automatically identify the type or identify of the vessels and Sentinel2 only works on cloud-free days.
- new algorithms can improve the quality. Incomplete trajectories can be accurately repaired using historical data.
Marinetraffic.com have produced digital map-layers indicating the reliability of the vessel density maps that will be made available through EMODnet and an improved open-source toolbox for producing the maps that is fully-documented and publicly available on GitHub
MarineTraffic blog


