This week saw several events related to climate change. On 28 June, the Council of the European Union adopted the European Climate Law which sets out a binding objective of climate neutrality in the European Union by 2050. [1] On 29 June, the Climate Pact Day of Action took place. The European Climate Pact - launched by the European Commission as part of the European Green Deal - invites people, communities and organisations to participate in climate action across Europe. The Climate Pact Day of Action aimed to show that, by taking action, we all have a part to play in building a greener tomorrow.
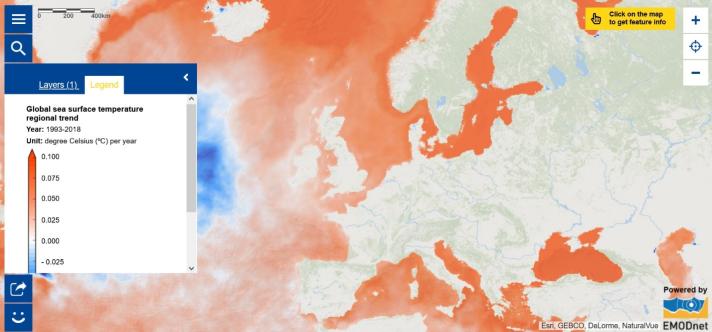
How is climate change affecting the ocean? The Copernicus Marine Service Ocean State Report published in 2020 provides a summary overview on the major impacts of increasing greenhouse gas emissions and resulting climate change on the ocean including ocean acidification, ocean warming, sea level rise and decreasing sea ice extent in the Arctic. It points out that Ocean Heat Content and Sea Surface Temperature are two important measures of ocean warming. Ocean Heat Content represents the heat energy stored in the ocean. Sea Surface Temperature is an Essential Climate Variable which provides insight into the flow of heat into and out of the ocean. The Copernicus Marine Service time series shows that the average global sea surface temperature has risen at a rate of 0.015 ± 0.001 °C per year between 1993 and 2019. Sea Surface Temperature does not rise homogeneously and thus some regions are more threatened than others. Ocean warming contributes to sea level rise and threatens marine ecosystems, putting people, economies and food security at risk.
In addition to climate change mitigation, climate change adaptation is therefore essential to face the impacts of climate change and build resilience. This was the subject of the 5th European Climate Change Adaptation Conference (ECCA 2021) which took place from 25 May to 22 June 2021.
What can you do?
- Explore the Map of the Week to learn more about global sea surface temperature regional trend;
- Watch the recording of the Climate Pact Day of Action and make your pledge;
- Watch the ECCA 2021 recording and search the Climate-ADAPT website to learn more about climate change adaptation;
- Participate in the ‘Make Europe Blue’ campaign and submit your pledge for the ocean;
- Learn about the activities of the EU4Ocean Coalition and join its members to work on Ocean Literacy.
Wish to know more about the European Atlas of the Seas? Visit the European Atlas of the Seas space in the EMODnet virtual exhibition!
The data in this map are provided by Copernicus Marine Service.
[1]https://www.consilium.europa.eu/en/press/press-releases/2021/06/28/council-adopts-european-climate-law/

